
In its most basic form, a pump curve displays two things: Flow and Pressure. However, depending upon its sophistication, it can also show information like efficiency, power etc. Reading a pump curve correctly helps you discern whether the pump is suitable for your application. VEMC is one of the leading water pump dealers in Mumbai, and in this blog, we teach you to read a water pump curve.
How to read the pump curve
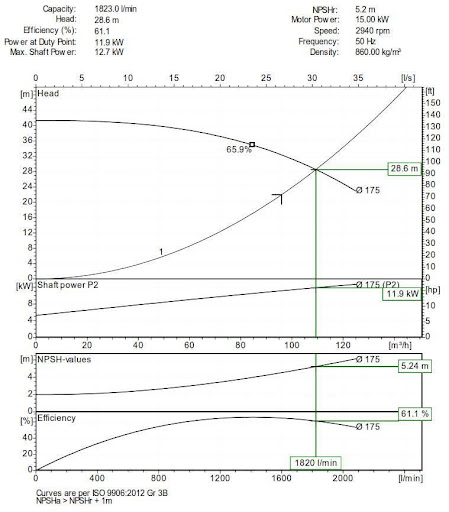
As mentioned above, a water pump curve shows the relationship between flow rate and pressure. Usually, the flow rate is shown on the horizontal axis and pressure on the vertical axis. So the curve displays the flow rate at a certain pressure or conversely the pressure of water at a certain flow rate. It is presumed that the water pump curve has been plotted for water.
Let’s take the adjacent graph for illustration. As you can see, the pump produces no flow at 41 meters of head and a maximum flow of 2100 litres per minute at 23 meters. This is because a pump operates under a number of influences such as speed and frequency of the motor which affect its flow and pressure. The speed of the motor for instance, directly impacts the flow rate and pressure.
Selecting the right pump based on requirements and operating point
A system curve is another graph to watch out for. It plots points between resistance of a system (head to be overcome by the pump) and flow rates. The system curve depends on factors such as height, diameter or length of piping, fitting type and number etc. The suitability of a pump is determined by how well the pump and the system curves match. The pump operating point is where the system curve crosses the pump curve on superimposition.
Limitations of pump curves
While pump curves are extremely useful tools to understand the relationship between your pumps’ flow rate and pressure, and also to determine the right pump for the right task, they do have certain shortcomings as well.
A pump curve does not explain the relationship between operating point and equipment reliability which experts consider highly important. This relationship makes a huge difference in terms of pump longevity, and cost of repairs and replacement.
Likewise, the Best Efficiency Point (BEP) indicates the point or area with highest efficiency for a given impeller diameter. In an ideal world, pumps would never operate outside of a BEP. However, in reality, factors like system upsets and fluctuating demand can make the BEP to shift. This can cause cavitation, rise of temperature, or wear and tear of seals and bearings.
For more on how to use tools like the water pump curve to make the right pumping decisions, feel free to speak to our experts by calling us at 022 43436655 or emailing us at marketing@vemc.co.in. We are the top Kirloskar pump distributor based in Mumbai with decades of rich experience and unparalleled expertise in pumping.